

Welcome to the 2020 Norwood Community Survey! The following is one man’s attempt to better understand the issues facing Norwood, Ohio. In subsequent posts, I’ll be releasing summaries of attitudes about each ward, the schools, and city-wide issues. But, for now, here’s the backstory of the survey and an overview of who participated.
Disclaimer: the administration of the City of Norwood had nothing to do with this effort.
How the survey came to be
It started around the 2019 election. While interviewing candidates for the Move Norwood Forward podcast, it was interesting to me how certain folks seemed fixated on certain issues, but didn’t care about others. I got to thinking “wouldn’t it be nice if we had tangible, measurable data about how residents felt about local matters?”
It’s my personal belief that Norwood’s lack of community gathering spaces fuels our Facebook-heavy civic life. And often times, it’s hard to differentiate “what’s true” from “who’s loudest.” This is my attempt to find some kernels of truth about what Norwoodians are thinking and feeling about the state of our city. If repeated over time, this could be a powerful tool for identifying trends and staging interventions.
How the 2020 Norwood Community Survey was distributed
Figuring out how to distribute the survey was a challenge. Since I can’t afford to print 10,000 flyers and mail them to every residence in Norwood, I had to take a different approach. Around August of 2020, with political season drawing near, it dawned on me that people who have opinions about politics are advertising it in their front yards with their political signs. So, I set out to hand-deliver leaflets to every house in Norwood that had a sign in its front yard — Republican, Democratic, local, national, Norwood schools, etc. With the help of a couple friends, we walked every street in Norwood and delivered about 1,000 leaflets.
Another benefit of this approach was that it was random. Whereas posting the survey on Facebook might lead to a response group that’s younger and/or more tech-savvy, this approach was more equitable, I think. In response to the flyer-on-porch approach, about 150 people responded.
Wanting to increase the number of responses, especially from Wards 1 and 4, I followed up with every respondent from those wards via email (if they provided an email on their original survey). I asked them to forward the survey to a few of their neighbors, which increased participation. Eventually, I did the same for Ward 3.
It’s worth noting that Ward 2 ended up with the most respondents, based solely on delivering flyers. I never emailed the respondents to try to get more Ward 2 responses. I suspect this might be related to me and Move Norwood Forward having more name-recognition with my more-proximate neighbors, but who knows.
Who took the survey
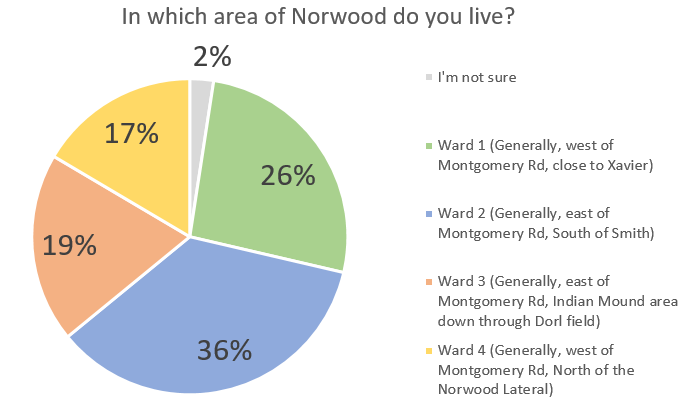
In total, I received 206 responses to the 51-question survey. The breakdown of participants is as follows:
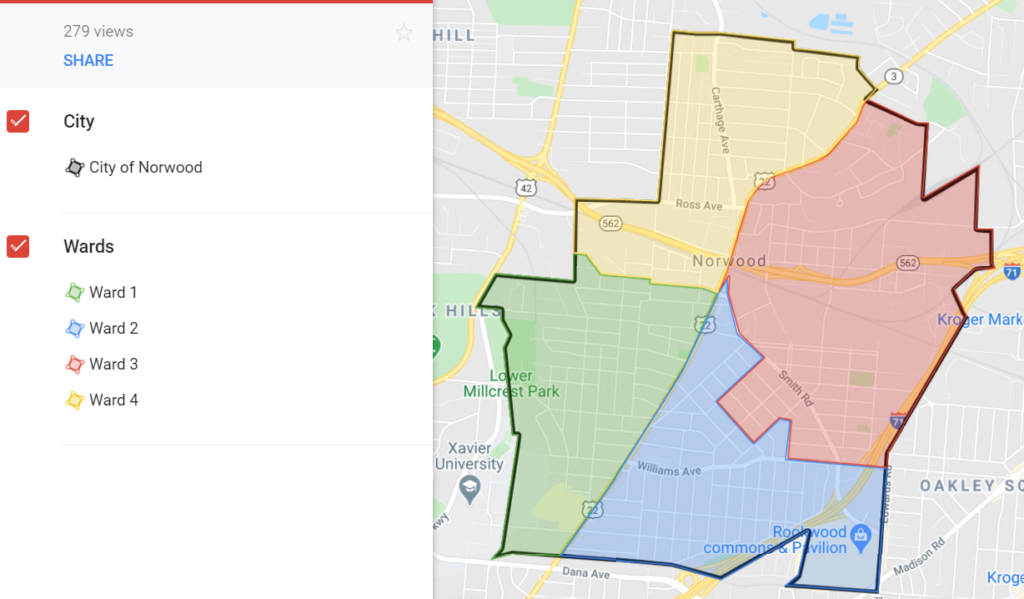
In case anyone needs a refresher, here is the map of Norwood’s wards.
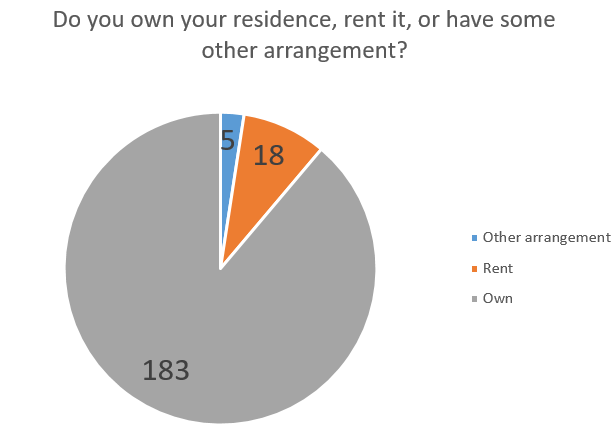
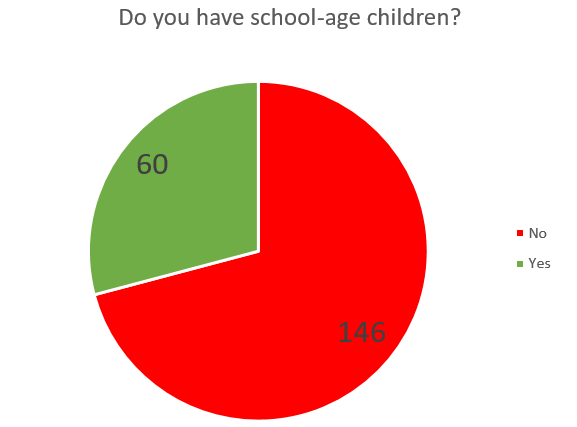
Editor’s note: In retrospect, it’s not surprising that this skews so heavily toward homeowners. Because I focused on delivering flyers to people with political signs in their yard, that probably limited my exposure to renters. This might be because renters live in multifamily housing where the yards is shared and/or because they feel less empowered to put political signs in a yard where they rent. Lesson learned.
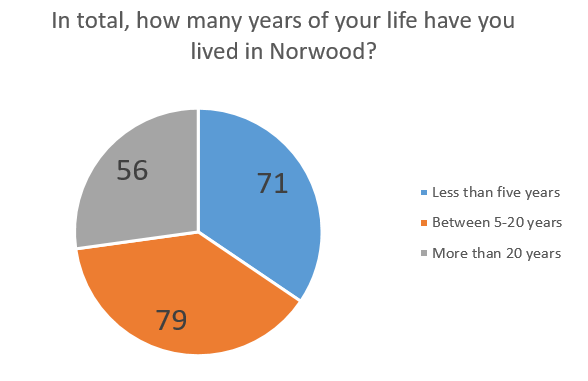
Editor’s note: Probably the thing I’m most proud of in this survey was that we managed to reach a healthy blend of new, medium-term, and long-term residents. This survey was much bigger than me and my nearby neighbors.

Editor’s note: Because of delivering flyers to people with yard signs, the respondents skew heavily toward those who are politically-engaged. Of Norwood’s 12,000+ registered voters, I don’t think more than half have watched or attended a council meeting, as is the case with our survey participants.
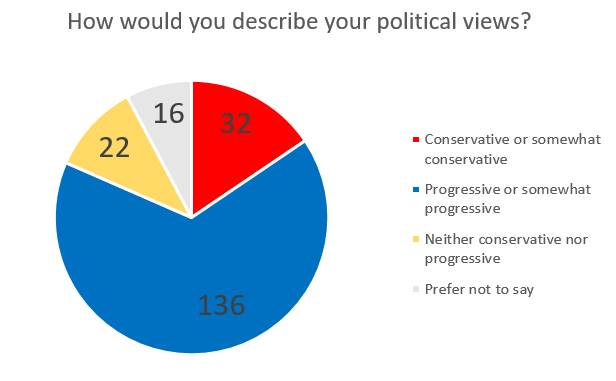
Editor’s note: This was really surprising because the yard signs I was seeing were pretty-evenly split between conservative / progressive, and Norwood is typically a mixed bag in how it votes. The only thing I can figure is that conservative folks might be less likely to respond to a random note on their door step and/or be more suspicious of sharing their opinions online with a stranger. I genuinely don’t know, but I certainly made an effort to deliver them to people with signs of all kinds.
What did the survey ask about?
As I mentioned before, there were 51 questions on the survey, which took about 10 minutes to complete. 16 of those questions allowed for open-ended responses (qualitative). The other 35 asked residents to rate their feelings about different aspects of our community in a more objective way (quantitative). Besides the basic, demographic questions about who was taking the survey — which ward they lived in, how long they’ve been in Norwood, etc — the questions were about:
- their area of Norwood
- community organizations and involvement
- local government and the services it provides
- parks, infrastructure, and local businesses
- schools
Since community surveys are a common practice across America — but not in Norwood — I had plenty of material to draw from, like this community survey from Roseville, MN (population: 36,000). After looking through a number of examples, I curated it down to what I thought was a manageable number.
Note that city-level issues were the only things I asked about. This survey is about Norwood and bettering our community — not national politics, or topics you’ll see on cable news networks.
How confident can we be in the results?
In 2019, there were 12,540 registered voters in Norwood. To get 206 responses to a survey means that we can be 95% confident that the attitudes reflected in the survey are within a 6.2% margin of error about the true feelings of all registered voters.
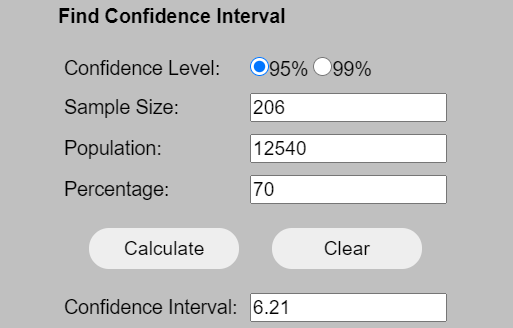
Put in tangible terms, when 70% of respondents say they think the Montgomery Rd corridor reflects poorly on our city, we can be 95% sure that if we polled all 12,540 registered voters, the overall dissatisfaction with our business district will be somewhere between 76.2% dissatisfied and 63.8% dissatisfied (70% plus or minus the 6.2% margin of error).
Long story short — I won’t pretend these results are perfect, and I know that many people didn’t get to take the survey… but I do strongly believe that this is directionally-helpful in understanding and prioritizing the attitudes of Norwoodians.
Where can I see the results?
In the coming days, I’ll be publishing the following content on this site and sharing it on the Move Norwood Forward Facebook page.
- 9 things Norwoodians agree about
- Ward 1 summary
- Ward 2 summary (forthcoming)
- Ward 3 summary (forthcoming)
- Ward 4 summary
- Analysis of attitudes about Norwood City Schools (forthcoming)
I hope you will find the fruits of the 2020 Norwood Community Survey to be as fascinating and insightful as I do. At the end of the day, my sincere hope is that residents and elected officials will use these results to create action plans that will help move Norwood forward.
—
Move Norwood Forward aims to shed light on the people, businesses and happenings of Norwood, Ohio that are working to better the city. If you know of a person who should be featured on an episode, nominate them here.