
The great thing about Norwood is that we’re a smaller city where everyone has the opportunity to be heard. Unfortunately, though, sometimes all those voices make it hard to separate “what’s true” from “who’s loudest.” To try to bring some objectivity to the issues that are more important to residents, I launched the 2020 Norwood Community Survey. In a place where arguing often feels like a local pastime, the following are nine things Norwoodians agree about (for the most part).
About the Survey
The survey contained 51 questions that asked residents about:
- themselves
- their neighborhood
- community organizations and involvement
- local government and the services it provides
- parks, infrastructure, and local businesses
- schools
In total, 206 responses were received. If you want a detailed overview of the 2020 Norwood Community Survey, including how the survey came into existence, and who participated, please see the first post in this series (linked above). In short, those 206 respondents were…
- a balanced mix of newer and long-time residents
- mostly homeowners
- spread across all four wards (each ward had between 34 and 73 participants)
Disclaimer: the administration of the City of Norwood had nothing to do with this effort.
How well does the survey represent resident opinions?
In 2019, there were 12,540 registered voters in Norwood. To get 206 responses to a survey means that we can be 95% confident that the attitudes reflected in the survey are within a 6- or 7-percent margin of error about the true feelings of all registered voters.
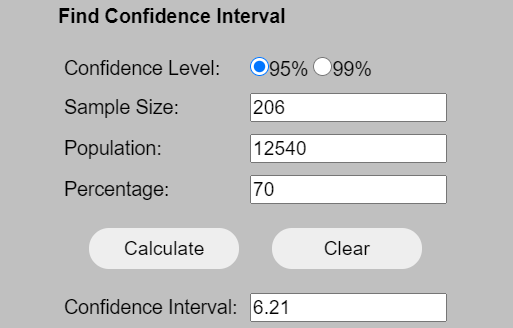
Put in tangible terms, when 70% of respondents say they think the Montgomery Rd corridor reflects poorly on our city, we can be 95% sure that if we polled ALL 12,540 registered voters, somewhere between 63.8% and 76.2% of the population would express dissatisfaction with our business district (70% plus or minus the 6.2% margin of error).
9 Things Norwoodians Agree About
Note that the topics below are sorted based on the concept of a Net Promoter Score and reflect the spread between people who are “for something” and people who are “against something.” So, if they seem a little out of order, that’s why.
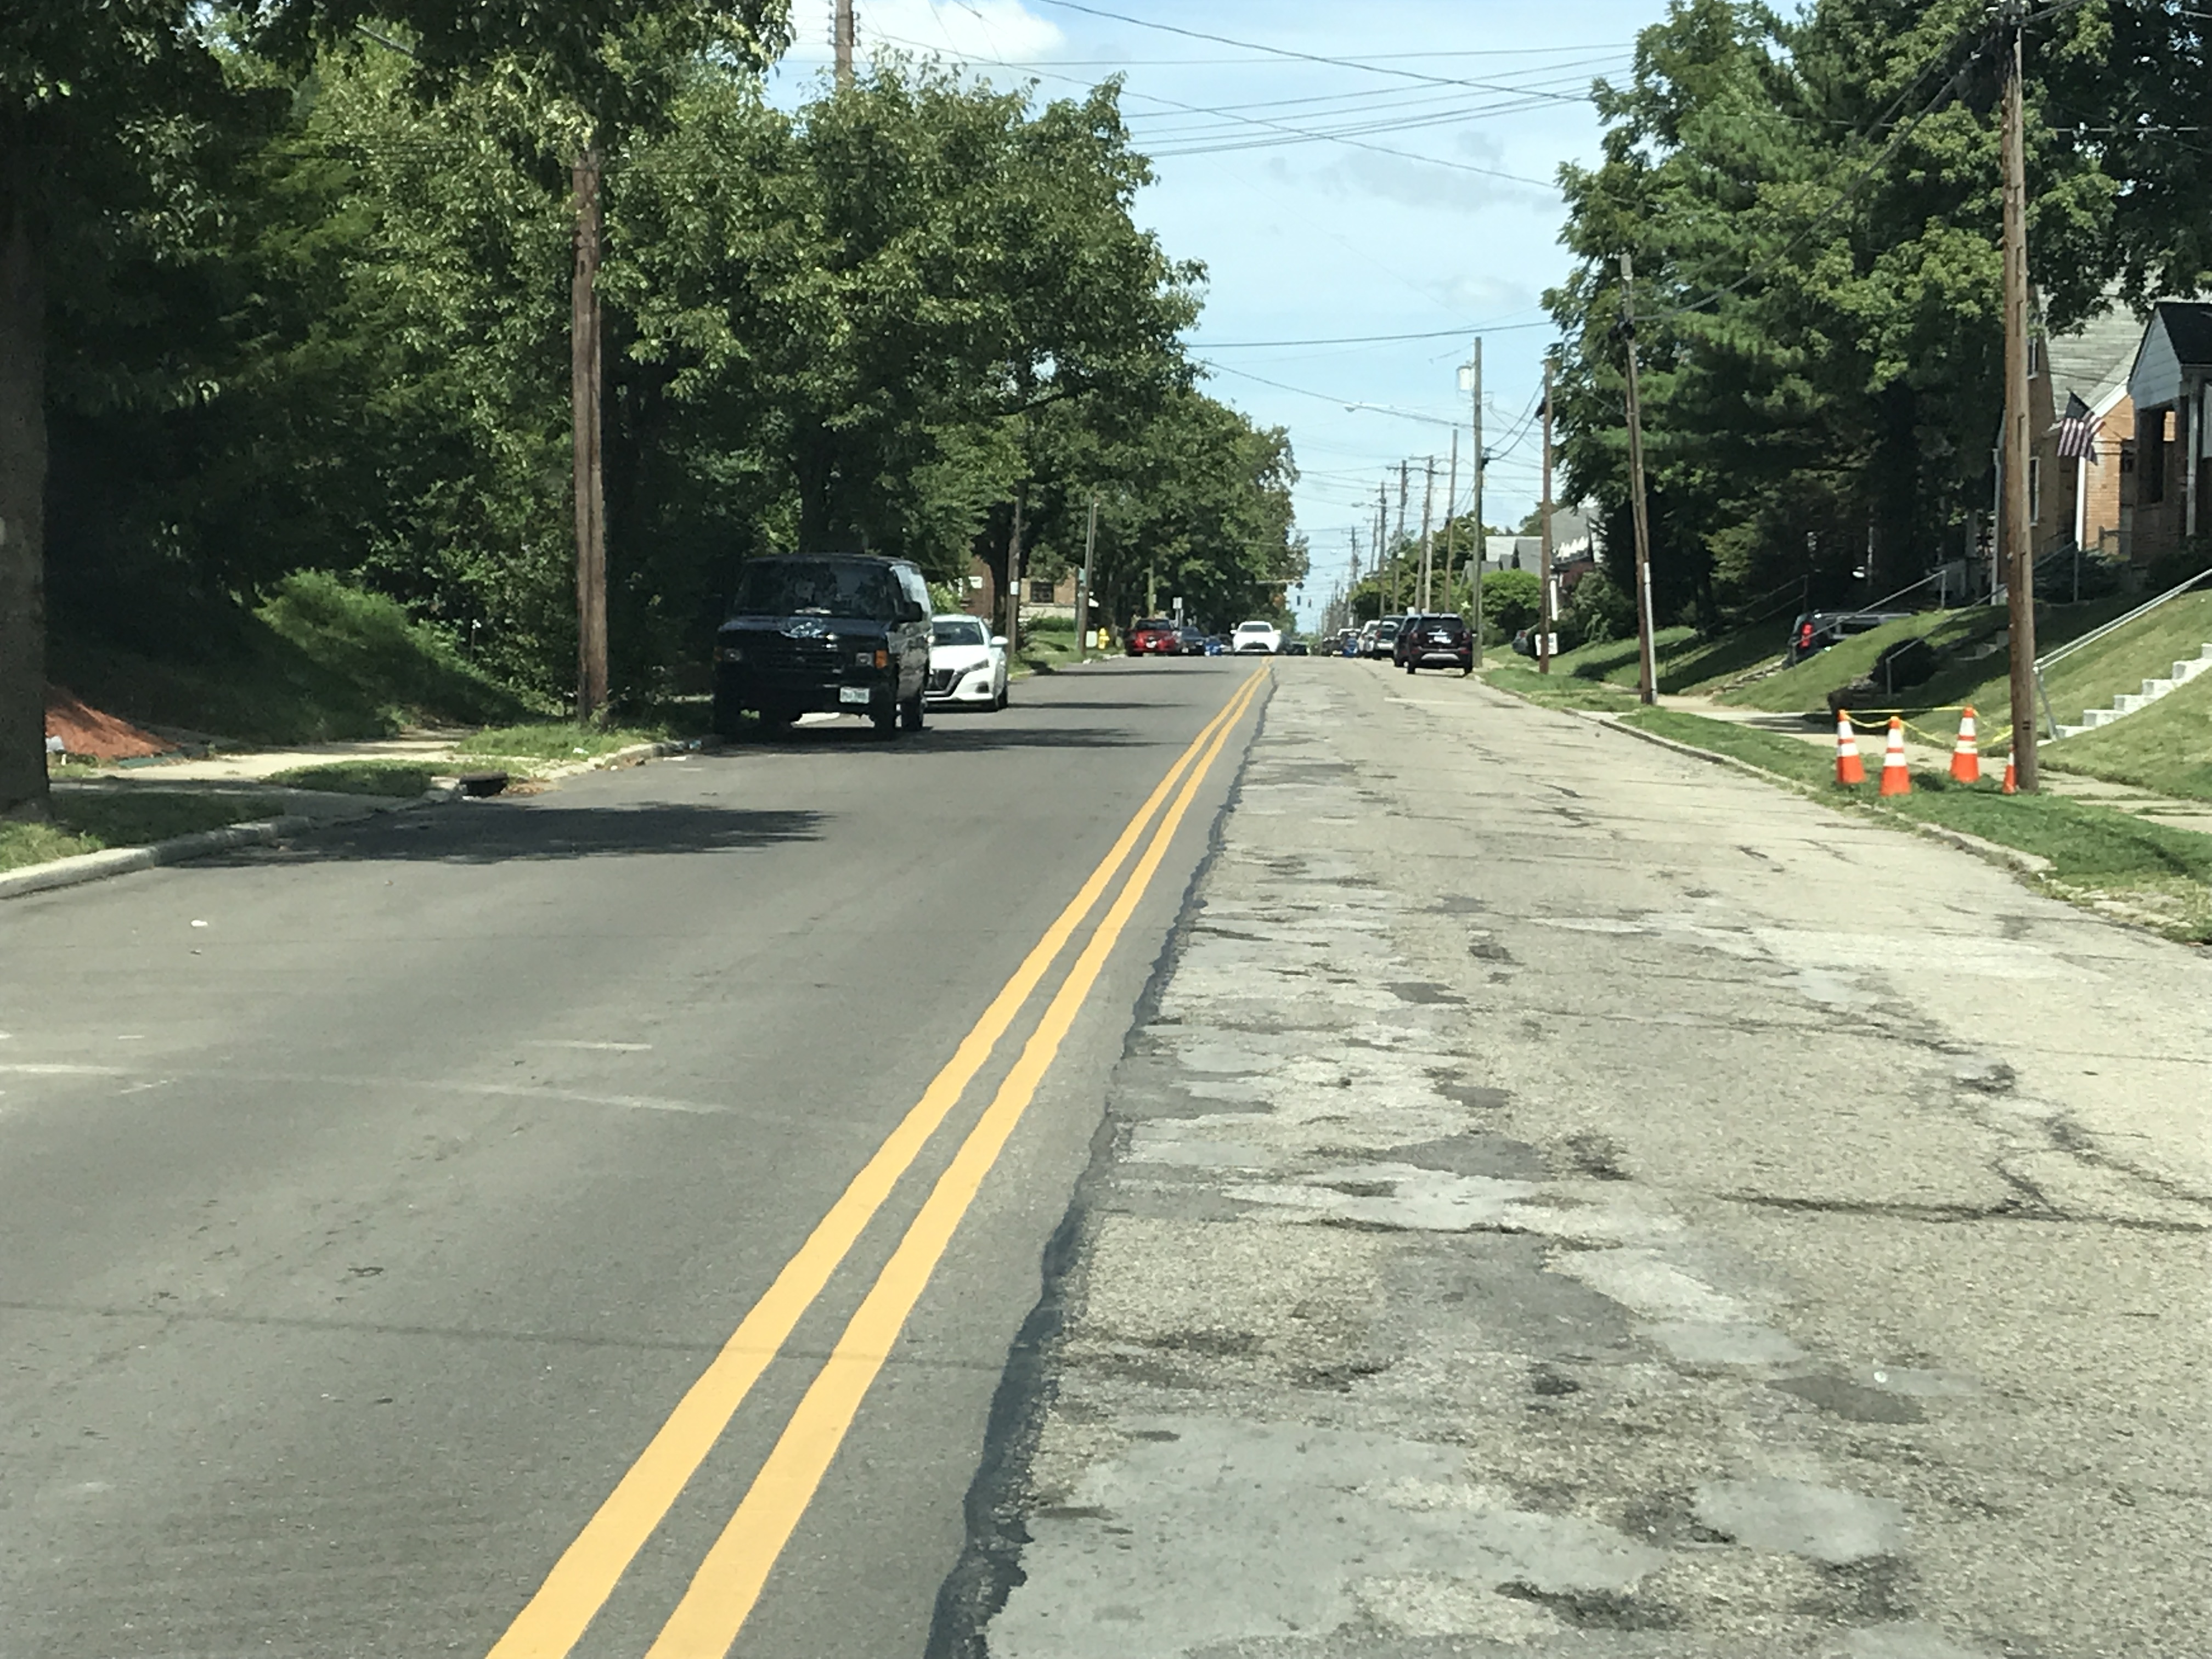
Most of us are dissatisfied with the roads
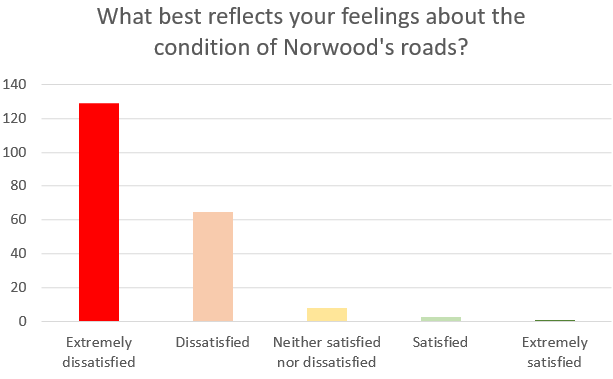
94 percent of respondents expressed some level of dissatisfaction with our roads.
–
Most of us feel safe in Norwood
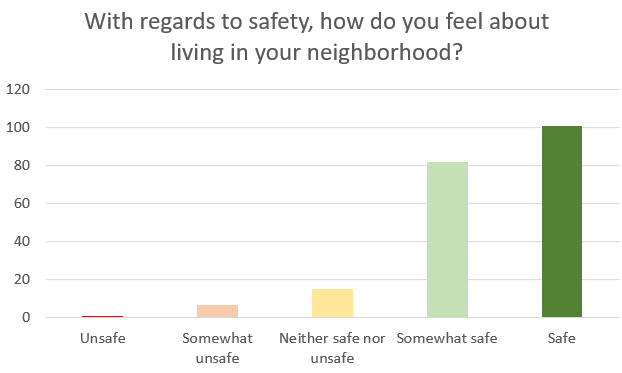
89 percent of respondents reported feeling some level of safe.
–
Most of us feel that Norwood is improving
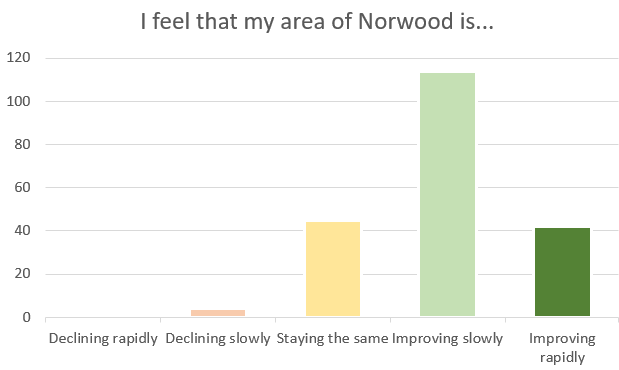
75 percent of respondents feel that their area is improving to some degree.
–
Most of us feel that Montgomery Rd reflects poorly on Norwood
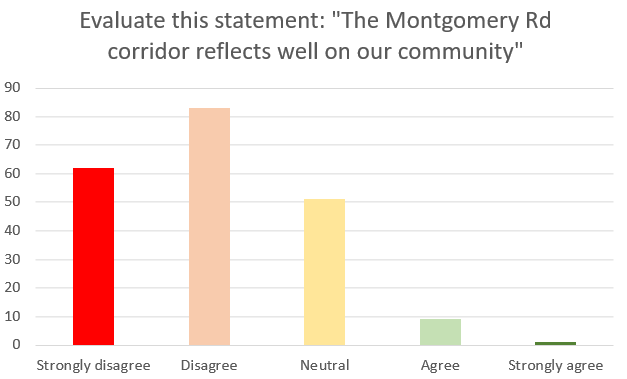
70 percent of respondents feel that the Montgomery Road corridor is a poor reflection on the city.
–
Most of would support a tax levy that could ONLY be used for a comprehensive road repair program
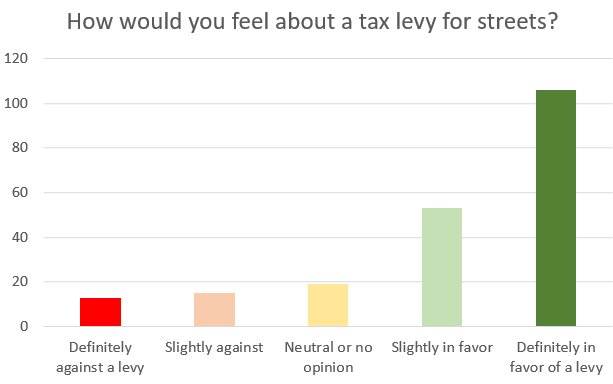
77 percent of respondents are supportive of a tax levy for a comprehensive road improvement project. How much that levy would need to be for remains to be seen, but I recently tried to project the cost of repairing Norwood’s roads over the next 15 years.
–
Most of us hold favorable views of the Norwood Fire Department
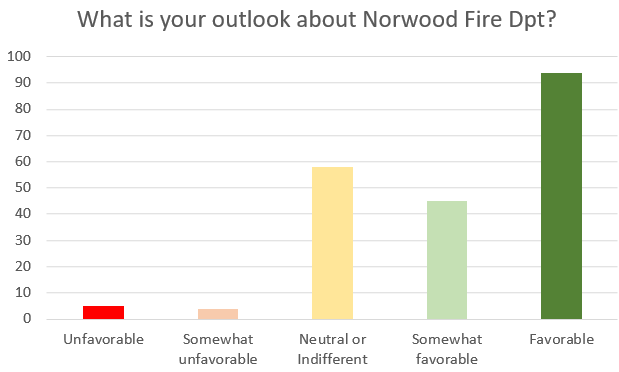
68 percent of respondents hold favorable view of the Norwood Fire Department.
–
Many of us see ourselves in Norwood for the next 5+ years
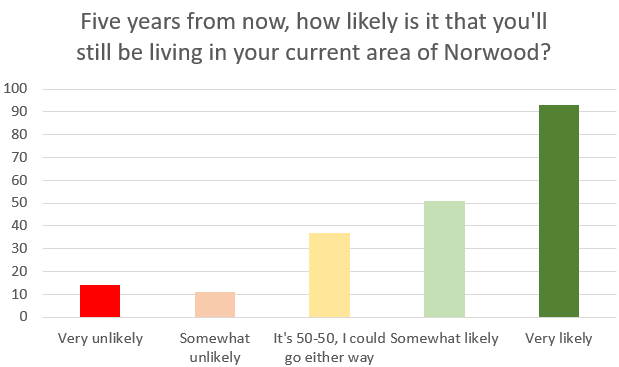
70 percent of respondents consider it likely that they will still live in Norwood five years from now.
–
Many of us wish there were more businesses within walking distance of our homes
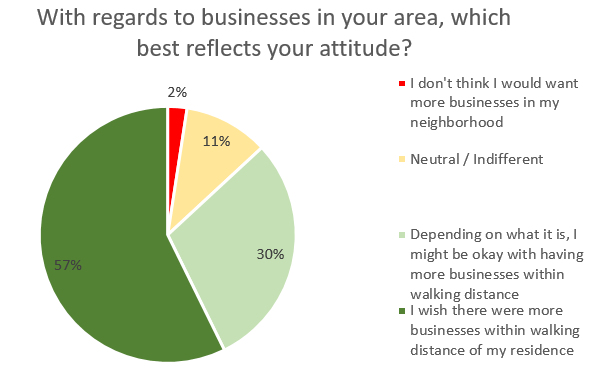
57 percent of respondents actively want more businesses within walking distance of their residence.
–
Many of us don’t trust that the city is using our tax dollars wisely
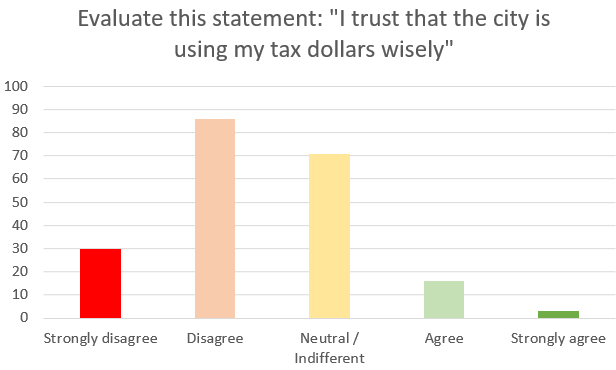
56 percent of respondents feel some level of distrust that the city is using their tax dollars wisely.
–
Next steps for the City of Norwood?
Bringing into focus the most important issues makes it easier to start ideating about solutions. In that spirit, I invite you to leave a comment with an idea you have for bettering one of the nine topics mentioned above.
Obviously, not everyone agrees with the nine statements made above, but most people do. If you find yourself in the minority in one of these aspects, I’d be curious to read your comments too.
Stay tuned for the ward-specific breakdowns, which will be published in the first two weeks of March 2021. They are much more detailed and, in my opinion, paint the picture of a nuanced city whose wards each have unique needs. Those articles also include open-ended commentary on many different issues, which make them a fascinating read.
—
Move Norwood Forward aims to shed light on the people, businesses and happenings of Norwood, Ohio that are working to better the city. If you know of a person who should be featured on an episode, nominate them here.
This is great data! Thank you for collecting the survey and putting this together. I think the last data point is super interesting. I’d like to know more about where are tax dollars are going (since they are not going to improving our roads).
Thanks, Amy! As best I can tell you, the money is going to police and fire services. Here’s the auditor’s site, which is pretty illuminating: http://www.norwoodauditor.com/